Prop Firm Risk Management Rules That Work
By Clara Morel·

Prop Firm Risk Management Rules That Actually Keep You Funded
Key Takeaways
On a $100K account with a 5% daily drawdown limit, risking 1% per trade gives you exactly five losing trades before breach. Cutting that to 0.5% doubles your buffer to ten, which is the margin most funded traders actually need.
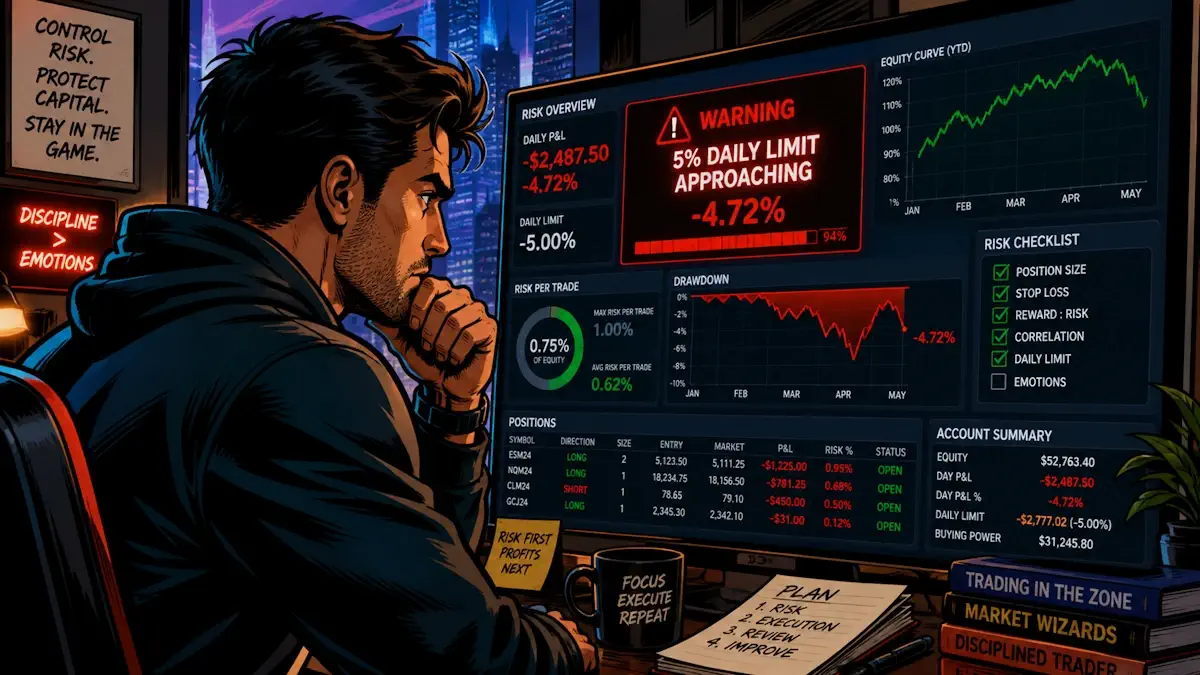
The most dangerous point in a funded account isn't a losing streak. It's sitting at 70% of your daily drawdown after two losses, because that's where traders shift from executing their edge to trying to avoid the loss, which destroys trade quality.
Static and trailing drawdown models require different position sizing strategies: trailing drawdown locks in a rising floor as your balance grows, meaning a winning run can shrink your real margin more than the numbers suggest.
Most traders who blow funded accounts aren't bad at trading. They're bad at running the numbers before the session starts. Prop firm risk management rules aren't complex on paper: a daily loss limit, a maximum drawdown, some position size constraints. The problem is that those rules interact with each other in ways that bite you mid-session, especially when the market isn't cooperating. This article works through the math on a $100K account, builds a personal buffer framework, and explains why the psychology of "don't lose" is more dangerous than a losing streak.
Every prop firm challenge gives you two hard limits: a daily drawdown (what you can lose today) and a maximum drawdown (what you can lose total). The typical industry setup is a 5% daily limit and a 10% maximum drawdown on a $100K account. That's $5,000 per day and $10,000 total.
Those are the firm's limits. They shouldn't be your limits.
The firm's daily limit is the wall. Your personal walk-away threshold is the buffer zone you set before the wall. If you trade all the way to the wall every time you have a bad day, you'll eventually be standing at $90,001 in equity, one bad trade away from termination, trying to decide whether to take the setup. That's not a trading decision. That's survival mode, and survival mode produces terrible entries.
A workable personal threshold is 60-80% of the daily limit. On a $100K account with a 5% daily limit, that means stopping at $3,000-$4,000 in daily losses. You still have room. You haven't violated anything. You live to trade tomorrow.
This is where most educational content goes abstract. Here's the concrete version.
The standard formula (position sizing methodology via Investopedia):
Lot Size = (Account Balance × Risk %) ÷ (Stop Loss in Pips × Pip Value)
For EUR/USD, one standard lot moves approximately $10 per pip. One mini lot moves $1 per pip.
Risk Per TradeDollar Risk ($100K account)Lots (25-pip stop, EUR/USD)Max Consecutive Losses Before 5% Daily Breach0.25%$2501.0 mini lots200.50%$5002.0 mini lots101.00%$1,0004.0 mini lots51.50%$1,5006.0 mini lots3
The 1.5% row is what kills accounts. Three consecutive losses (which is a completely normal run in any liquid market) and you're done for the day, assuming you haven't set a personal threshold. If your strategy has a 50% win rate, a sequence of three losses happens roughly 12.5% of the time. You'll see it multiple times per month.
The 0.5% row is what most funded traders who last more than 90 days actually use. Ten consecutive losses before daily breach. That gives you the ability to trade through a genuinely choppy session without catastrophic consequences.
The formula above uses a fixed 25-pip stop. Most traders don't trade with a fixed stop. If your typical EUR/USD setup has a 40-pip stop, the same $500 risk drops you to 1.25 mini lots. If you widen to a 60-pip stop to accommodate volatility, you're at 0.83 mini lots.
The practical takeaway: pre-calculate your lot sizes for your three most common stop distances before you open the platform. Don't do the math mid-session.
For forex instruments like GBP/USD or USD/JPY, pip values differ. GBP/USD is also roughly $10 per pip per standard lot, but crosses like EUR/GBP have materially different pip values and require their own calculation.
Two firms can both offer a $100K account with a 10% maximum drawdown, and the actual trading experience is completely different depending on whether that drawdown is static or trailing.
Static drawdown means the floor doesn't move. You start at $100K, the floor is $90K, and it stays there regardless of whether you reach $115K in profits. Your room to operate expands as you grow.
Trailing drawdown means the floor follows your equity high-water mark up, but never comes back down. If you grow a $100K account to $110K, the floor has moved to $100K. Now you have exactly $10,000 of room, same as when you started. If you reach $115K, the floor is at $105K. A $10,500 drawdown from peak now terminates the account. The distinction between static and trailing structures is documented in detail by the ThinkCapital drawdown rules guide.
The implication for position sizing: during a strong winning run under trailing drawdown, your floor is rising in real time during open trades. A trade that runs to +$2,000 in floating profit before reversing has temporarily raised your floor. A full reversal doesn't just erase your profit, it can breach the limit without your realized balance ever showing the loss.
Some firms calculate trailing drawdown from equity (including open floating positions), which is the more restrictive version. Others trail from realized balance only. City Traders Imperium and similar firms that offer balance-based trailing give you more operational room. Check the specific rule before building your sizing plan.
For a detailed breakdown of how challenge parameters differ, the FundedNext challenge rules page shows how their drawdown model is applied at different account sizes.
Before each session, three numbers should be written down:
Your dollar walk-away threshold (e.g., $3,000 on a $100K account with a 5% daily limit)
Your risk per trade in dollars (e.g., $400 at 0.4%)
How many losing trades that gives you before you hit the threshold ($3,000 ÷ $400 = 7.5, so seven losses)
Seven losses in a session is unusual. If you're losing seven trades in a row, the setup isn't the problem. Something is wrong with your session selection, your read on the market, or your execution. Stopping at your walk-away threshold is the correct response.
The point of this exercise isn't to make you paranoid. It's to give you a concrete ceiling that removes the in-session calculation entirely. When you've established before the open that you stop at $3,000 down, you don't have to evaluate that question in real time while the market is moving. The decision is already made.
Funding Pips and similar firms structure their challenge rules in ways that reward this kind of consistency. Accounts that don't breach daily limits compound toward funded status; accounts that constantly approach the daily limit and recover are still generating risk that shows up in overall drawdown math.
Here's the specific failure mode that's worth examining carefully. A trader is down $2,800 on the day against a $5,000 daily limit. They have $2,200 remaining. Their brain shifts from "find the next A+ setup" to "I need to recover $2,800 without hitting $5,000."
That shift changes everything. Trades that wouldn't have been taken get taken because the P&L context pushes toward action. Stops get widened because a smaller position can't recover the drawdown fast enough. Entries get forced before confirmation because time pressure (session end, approaching the limit) creates urgency.
The result is a different quality of trading than the pre-session plan called for. The edge that works in a normal context doesn't work in deficit-recovery context, partly because the execution changes and partly because the market doesn't care about your drawdown situation.
The structural fix is the walk-away threshold described above. When you've already decided you're done at $3,000 down, you never reach the $2,800 danger zone where psychology takes over. You're stopped before you get there.
A secondary fix: reduce size after two consecutive losses. Some funded traders drop to 50% of their normal risk after back-to-back losses. Not because the market has changed, but because it preserves the option to keep trading. You can always scale back up when conditions improve or the session restores. You can't scale back up after a breach.
The5ers challenge structure explicitly favors steady, consistent performance over high-variance approaches, which aligns with this kind of risk-first thinking.

Using a fixed lot size instead of a risk-based lot size. A trader who always enters 2 lots on EUR/USD regardless of stop distance is risking different dollar amounts on every trade. On a 20-pip stop, 2 lots risks $400. On a 50-pip stop, 2 lots risks $1,000. The account can't absorb that kind of variance across a session.
Ignoring floating losses in equity-based drawdown accounts. If your firm calculates the daily limit from intraday equity rather than end-of-day balance, an open trade running against you counts in real time. A $1,500 floating loss on an open position plus a $1,800 realized loss from earlier in the session means you're at $3,300 against your daily limit, even if you haven't closed anything at a loss yet.
Recovering drawdown with larger positions. The math feels logical: you lost $1,000, so you need a bigger trade to get it back faster. The actual effect is that your daily limit now has less room and your position sizing has become emotionally driven rather than plan-driven. Larger positions in a losing state is how one bad day becomes a terminal account.
Not accounting for correlation. Running two EUR/USD long positions simultaneously, even labeled as separate trades, functions as one larger position. Most firms restrict this explicitly, but even where they don't, the risk accumulates exactly as if it were a single trade of the combined size.
Most funded traders who hold accounts long-term risk between 0.25% and 0.75% per trade. At 0.5% on a $100K account with a 5% daily limit, you have ten consecutive losses before daily breach. That's enough buffer to trade through a genuinely difficult session. Anything above 1% per trade compresses that buffer to five or fewer trades. For context on how risk-to-reward ratios interact with these numbers, Investopedia's risk/reward overview covers the underlying math.
Yes, it requires more caution, especially during profitable stretches. As your trailing drawdown floor rises with your equity high, a reversal from a peak has less room before it becomes a breach. Some traders drop to smaller sizes specifically when they're in strong profit on the day, because the floor is now higher and a pullback is more likely to cause an issue.
Yes. The walk-away threshold exists precisely because the assessment of "good setup" becomes unreliable once you're in loss-recovery mode. The session's data is compromised. A fresh session tomorrow with a clear head is structurally better than trying to recover today's loss in the final hour.
Balance-based calculates the daily limit from your realized closed-trade balance. Equity-based includes floating open-trade losses in real time. Equity-based is more restrictive because an open trade running against you consumes your daily limit even before you close it. Always confirm which method your firm uses before sizing positions.
Prop firm risk management rules work when the math is done before the session opens, not during it. On a $100K account, the difference between 0.5% and 1% risk per trade is the difference between ten losing trades before daily breach and five. That's the gap between a recoverable bad day and a terminated account. The position sizing formula is simple; the discipline to apply it consistently, especially when you're down on the session, is where most traders fall short. Build your buffer framework, pre-calculate your lot sizes for your common stop distances, and set your walk-away threshold before the open. If you're evaluating which firm structure gives you the best environment to apply this approach, review how different challenge parameters compare in the FundedNext challenge rules and The5ers challenge structure pages.
Sources checked: Investopedia position sizing and risk-reward methodology; publicly documented prop firm challenge rules and drawdown structures from multiple firms; industry-standard drawdown models as reflected in active firm documentation as of May 2026.
Last verified: 2026-05-05
What we couldn't verify: Specific current drawdown percentages and challenge parameters vary by firm and can change without notice. All examples use representative industry norms (5% daily / 10% max on a $100K account). Always verify live rules on each firm's official site before trading.
Written by: Clara Morel, Senior Analyst
Reviewed by: Lars Haugen, Senior Editor
PF Matrix independently verifies challenge rules, pricing, and firm data by checking official firm websites, help centers, and terms of service. We note when information could not be confirmed. Data such as pricing, rules, and discount codes can change without notice. Always verify current details on the firm's official site before purchasing.
Share this article
Clara Morel
Senior Analyst
Clara Morel is a Senior Analyst at PF Matrix with five years covering global markets. She studied economics in Lyon and specializes in macro analysis and trading strategy.
View all articles by Clara Morel